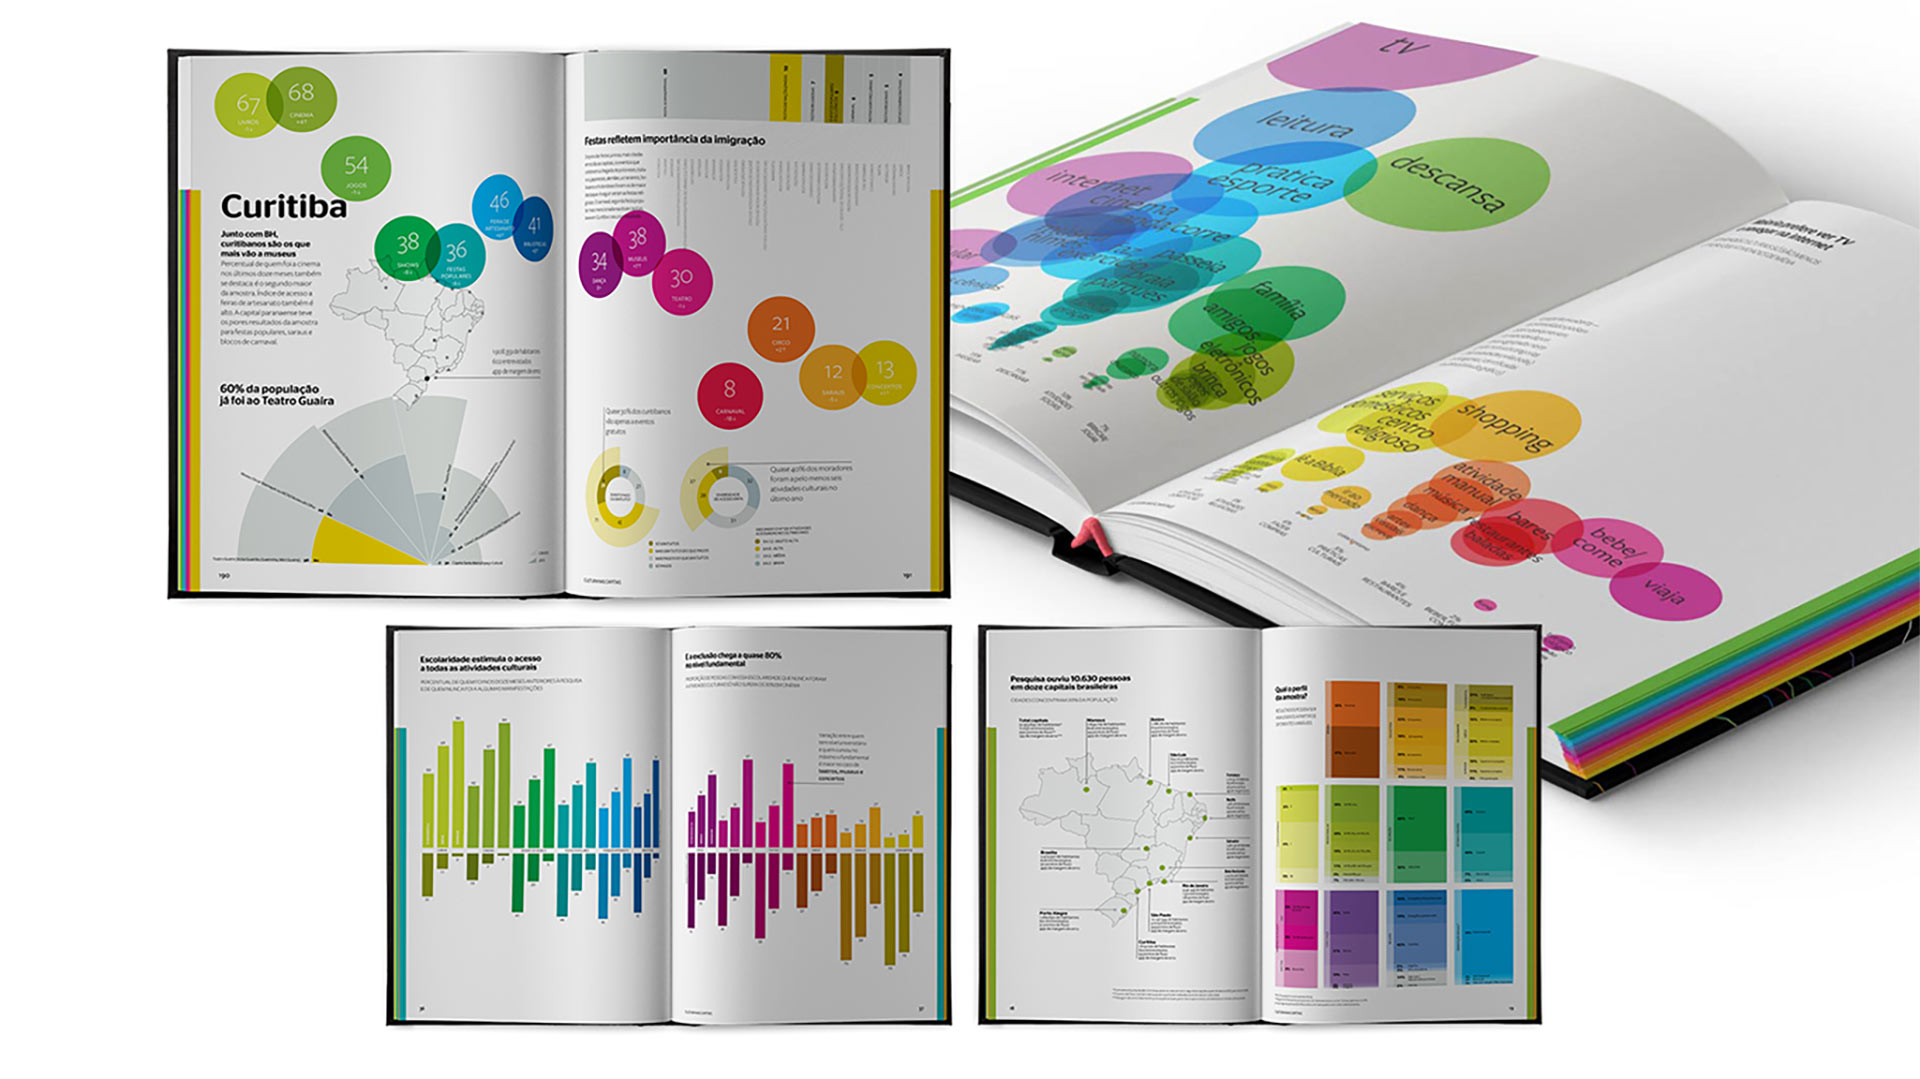
Cultura nas Capitais
interactive BI platforms, presentations and book
strategy & brand management • experience & design • digital & data
How might we engage people to visualize millions of cultural data points?
We were given the challenge to get people in the cultural industry to dig into what would be the biggest, most comprehensive, and highly customizable interactive database ever conducted in Brazil.
It should be able to arouse and hold the interest of an audience of “visual people” who is usually averse to data, graphs, and tables.
And we would need something to work in a fluid process of constant interaction with a multidisciplinary team.
Tremendous numbers for a colossal survey
From designing the platform’s brand and the visual universe to proposing a process and technology strategy best suited to handle the ginormous amount of data generated by more than 10 thousand in-person surveys collected across 12 Brazilian capitals, everything needed to be thoroughly planned.
How to be visually attractive and still clean enough not to compromise a naturally super complex universe?
With over 200 questions, 15 cultural areas, Millions of data-points, and hundreds of filters and correlations, the interactive platform (www.culturanascapitais.com.br) produces more than 12 Billion custom graphics.
Unprecedented information and insights on how Brazilians use, relate, and absorb cultural activities.
The interactive platform and printed book — did we mention there was a book? — have since been critical to providing informational and analytical input to decision-makers in the field.
It enables cultural players to access information and indicators that can now be used to plan governmental and private actions.
RESULTS
In the months following its launch alone, the project produced more than 400 stories on websites, magazines, newspapers, radio, and television programs. It has been widely adopted in the cultural sector and received kudos in the US and UK, where it has been presented in academic and cultural institutions.
WHAT WE DID
data visualization
data analysis
design thinking
design management
visual and brand identity
information design
editorial design
web design
presentations
promotional material
interactive infographics
process and technology strategies


